Context before prediction
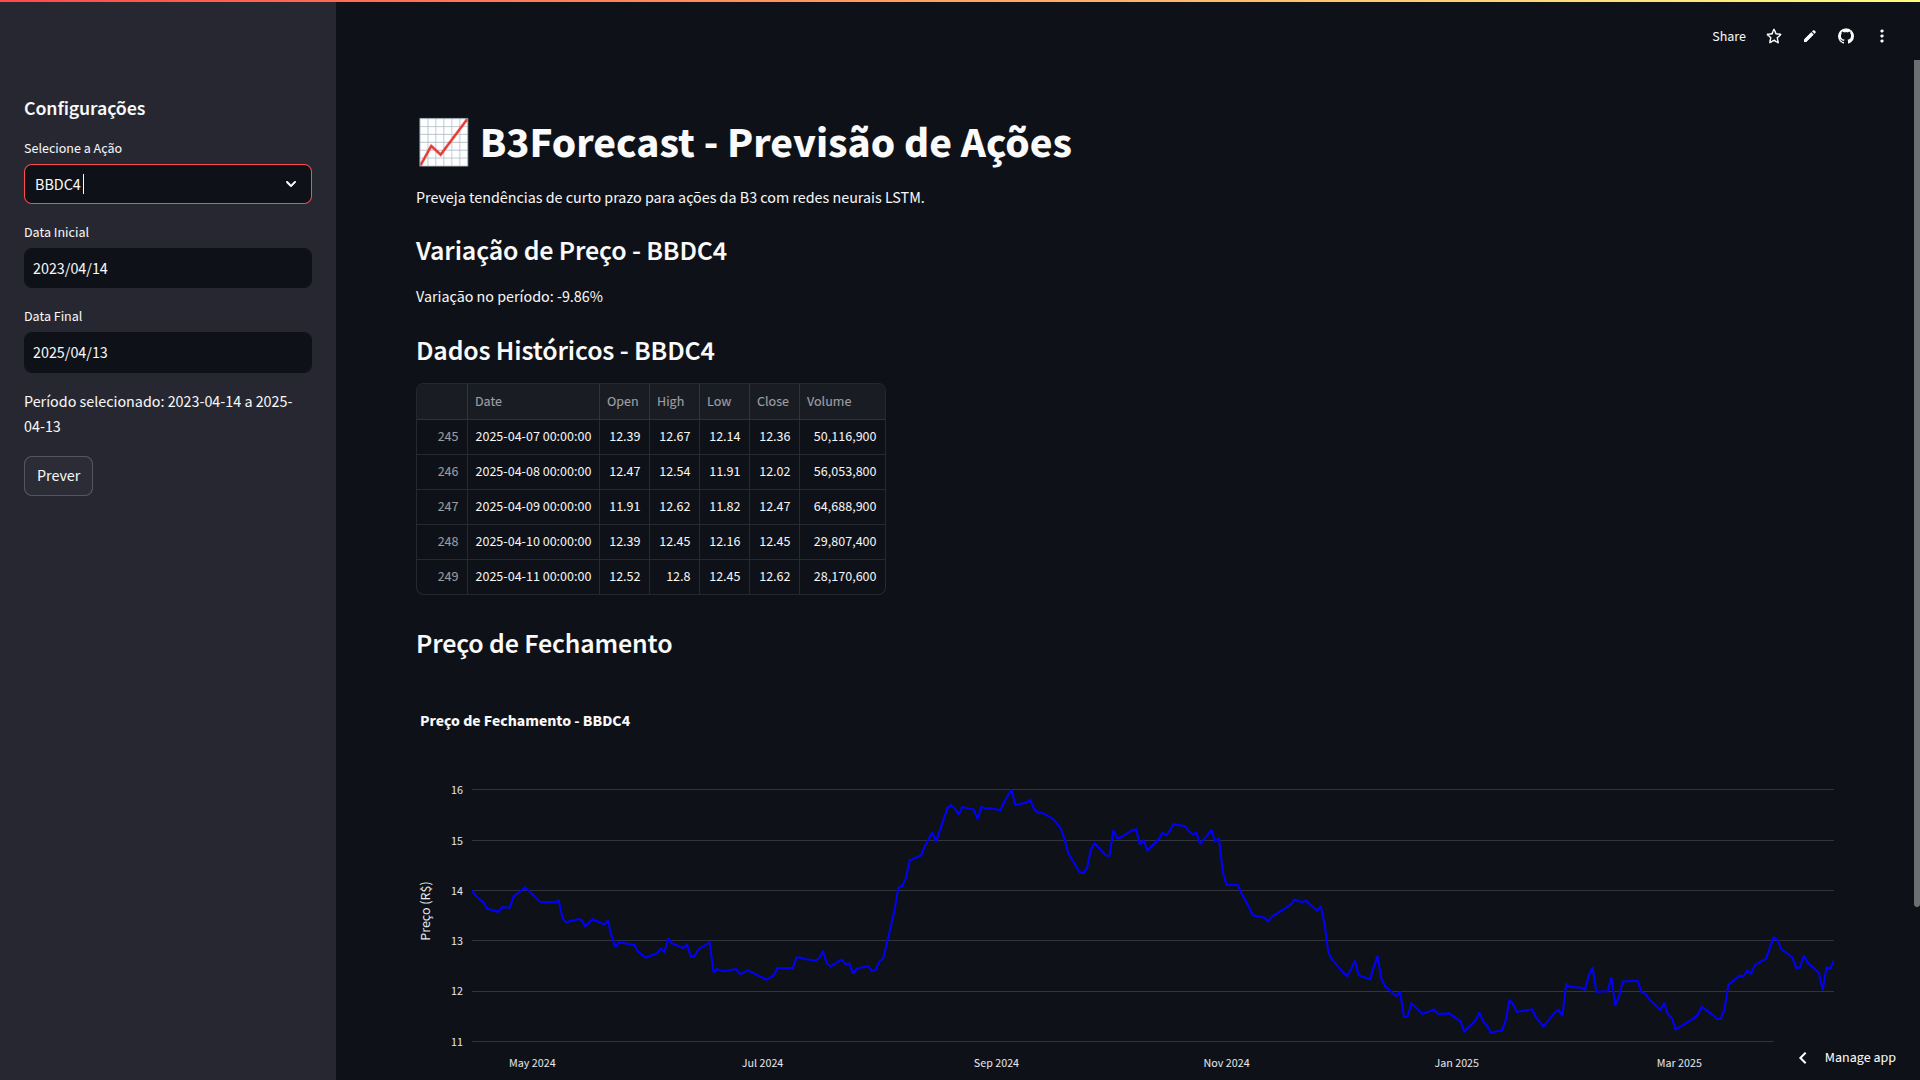
The selected asset, interval, historical table, and price series establish what the model is reading before its output is introduced.
Making a prediction useful begins with making its context visible.
A research interface for exploring Brazilian market history and turning LSTM experiments into an inspectable forecasting workflow.
01 / Challenge
Market forecasts are easy to present as a single answer and difficult to evaluate responsibly. The interface needed to keep source data, time range, model output, and historical context in the same readable flow.
02 / Decisions
The selected asset, interval, historical table, and price series establish what the model is reading before its output is introduced.
Configuration stays in a compact rail while the main canvas moves from historical evidence to visual exploration and model output.
The visual system avoids simulated exchange controls and keeps the focus on traceable inputs, charts, and model experimentation.
03 / Architecture
Asset and date-range selection
Python and Pandas time-series preparation
TensorFlow LSTM experimentation
Streamlit tables, controls, and chart views
04 / Outcome
The project became a working research surface where a visitor can inspect the data path instead of receiving an isolated prediction.