Threat state leads the page
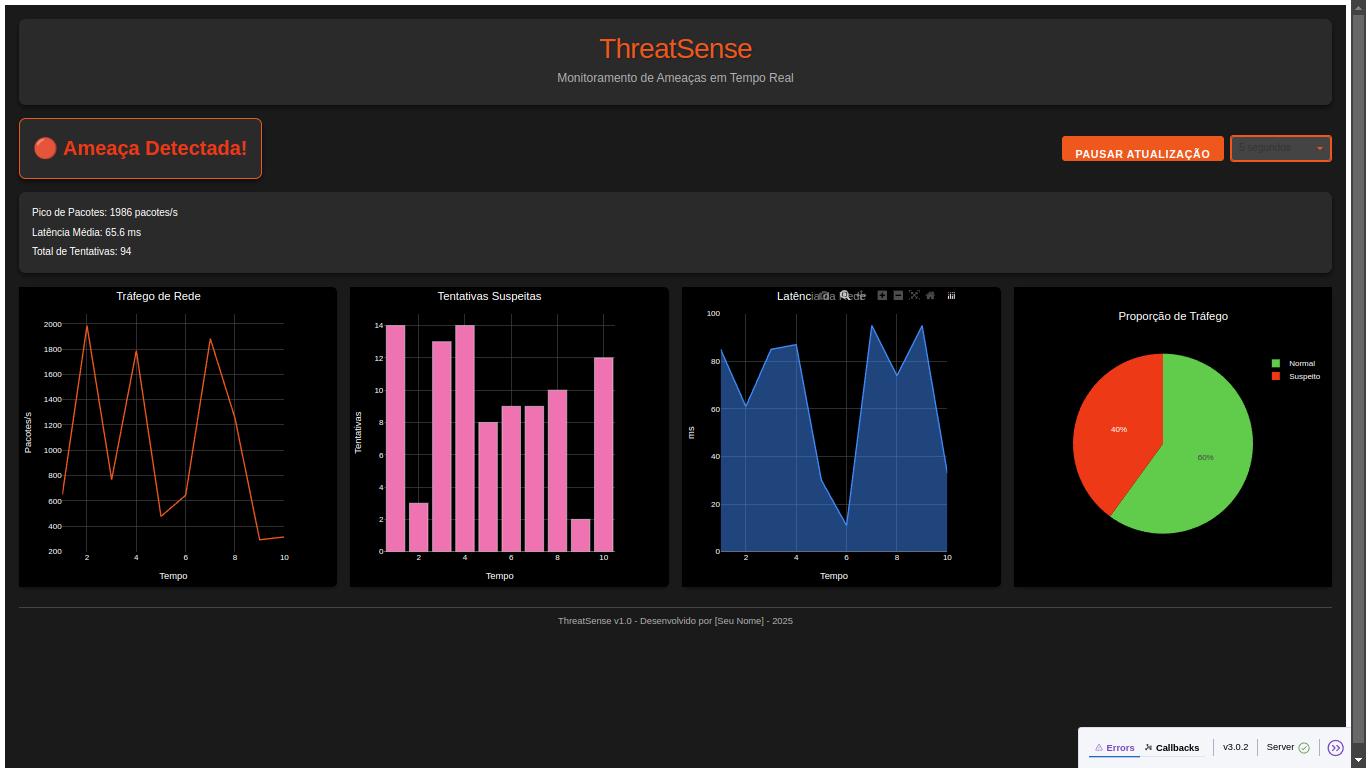
The current investigation state is separated from the analytical grid so it can be understood before reading individual charts.
A security interface should shorten the distance between signal and decision.
A real-time network analysis dashboard that turns changing traffic signals into a focused investigation surface.
01 / Challenge
Network monitoring produces several simultaneous signals. The challenge was to present traffic volume, suspicious activity, latency, and distribution without forcing the operator to assemble the story from disconnected charts.
02 / Decisions
The current investigation state is separated from the analytical grid so it can be understood before reading individual charts.
Line, bar, area, and proportion views use consistent spacing and update rhythm to behave as one monitoring system.
The interface includes control over updates so a changing state can be inspected rather than merely watched.
03 / Architecture
Homelab network traffic and Wireshark research
Python-based traffic classification
Timed monitoring updates and alert state
Dash and Plotly analytical views
04 / Outcome
ThreatSense turned a collection of network measurements into a single interface for observing, pausing, and investigating suspicious traffic patterns.